Folder views
Your graphs and logger databases are organized within folders, in a hierarchical system exactly like the way files are organized on your computer. At the root of this folder tree is your Home page.
Your Home page
You can find the following items on your home page:
- Loggers
This folder contains the logger databases of all devices linked to your account. When a device connects for the first time, it will create a database here, represented by a single unique graph.
- Map
This special Google map virtual folder contains all your zones and loggers, plus the zones and loggers of all users sharing with you. Every graph created from a logger can be viewed by clicking on the marker for the logger. Use "Add logger location" from the Map menu to add loggers without co-ordinates.
- Irrigate
This virtual folder contains links to all graphs owned by you or shared with you, where the last value is below the Refill or Stress lines, for loggers that have updated within the last 28 days.
- Watched
This virtual folder contains links to all graphs that you have chosen to watch.
- Faults
This virtual folder contains links to all loggers owned by you or shared with you, where a technical alert exists or a fault has been raised.
- Archives
When you create archives of old data, the archive folders appear in here. Click here for more information.
- Other users' Home folders
When a user elects to share with you, their Home folder will be linked from your own Home page. A padlock icon denotes that the share is read-only. You can remove a share from your Settings page.
- Zones
Zones are geographic boundaries. Your outermost zones appear as thumbnails of their boundary. Clicking a zone will show you a Google map containing all loggers that are located within the zone.
- Your folders
You can create folders for the purpose of organizing the graphs you create.
- Graphs
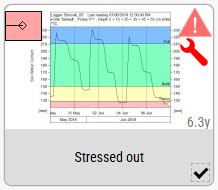
You can create graphs on your Home page or within your folders, within the folders of users you have created, or within the folders of users who share with you. The graphs will be presented differently depending on your viewing options. The thumbnail shown below is the default representation.
This is a graph where the soil water content has dropped below the Stress line. The gauge at the top left shows that it's in the red region. At the top right is a triangular alert indicator which you can click for more information. The stress condition has automatically triggered the alert, which will be included in your daily alert email. It probably isn't worth bothering with, however, because "6.3y" indicates that it's been 6.3 years since the probe last uploaded. If you click on the alert indicator you can choose to disable this alert so you won't be bothered with it any more. The spanner icon indicates that a fault has been raised. Click this for more information or to resolve the fault.
Item checkboxes
Many commands in the drop-down menus operate on a selected item or items. Check the checkbox of the items you wish to select. A range of items can be selected by checking the first, then holding down the Shift key and checking the last.
Popup menus
These menus are accessed by a click of the right mouse button, or a long touch without moving your finger.
- Right-click on an item in the folder to select that item's checkbox and show options relevant to the item. This unchecks all other items. To perform an operation on more than one item you must use the drop-down menus at the top of the page.
- Right-click empty space in the folder to show options that are not specific to a particular item
The File menu
Every folder has a File menu. You might not see all the options below, depending on the permissions of your account and the permissions granted to you for the folder.
The File menu for every folder except the Loggers folder contains these commands:
- New graph
Create a new graph from any database in your Loggers folder, or from the databases of users who are sharing with you.
- New folder
Create a new folder.
- New zone
Create a new zone by drawing its boundary and entering a name and other details.
- Rename
Rename a single selected graph or folder. Select the graph or folder by clicking its checkbox.
- Copy
Copy all selected graphs and folders. They are not actually copied until you choose Paste.
- Move
Move all selected graphs and folders. They are copied and the originals deleted when you choose Paste.
- Paste
Copy or move your selected graphs and folders into the current folder. You can paste copied graphs into the same folder you copied from and they will have (2) added to their names. You cannot paste copied folders into the same folder you copied them from.
- Paste (change loggers)
Copy or move your selected graphs with the option to specify new names and to change the logger databases to which they are linked. This allows you to use existing graphs as 'templates' for new graphs with different loggers. The sensor configurations of the loggers must match exactly.
- Email graphs
Email the selected graphs, or all graphs in the folder if no selection is made, to a user of your choice.
- Download graph PDF
Create and download a PDF file of all selected graphs, or all graphs if none selected. (Not available on mobile devices.)
- Download
Create a package of all selected graphs and their associated databases, then download it for use in IrriMAX 9.1 or later. (Not available on mobile devices.)
- Upload graph
Upload a single graph from your computer to the current folder. This can be a new graph, or you can replace an existing graph. The graph must have been created using databases that exist on IrriMAX Live. (Not available on mobile devices.)
- Delete
Delete one or more selected graphs and folders. When you delete a folder, you also delete all its contents.
The Loggers folder has different commands on the File menu:
- New meteoblue forecast db
Create a new meteoblue forecast database for a given latitude and longitude. Click here for more information.
- Temporary graph
Create a graph for the logger that only exists for as long as you are viewing it.
- Copy graph
Copy the default graph for the logger, so you can paste it in another non-Loggers folder.
- Download graph PDF
Create and download a PDF file of the default graphs for all selected loggers, or all graphs if none selected. (Not available on mobile devices.)
- Download databases
Create a package of all selected databases and their default graphs, then download it for use in IrriMAX 9.1 or later. (Not available on mobile devices.)
- Upload database
Upload a new database or update an existing database by supplying an IrriMAX database (SDB file), an IrriMAX-format CSV file or a special Excel worksheet. If the database already exists on Live, you can choose to append, prepend or replace readings. If prepending or replacing, your uploaded file must have an identical sensor configuration and logger ID. (Not available on mobile devices.)
- Email graphs
Email the selected graphs, or all graphs in the folder if no selection is made, to a user of your choice.
- Add to archive
Move the database to an archive, or move a range of readings to an archive.
- Delete
Delete a single selected database and all graphs everywhere that reference it. If the logger has uploaded in the last 7 days, the database will be recreated with the most recent configuration and up to 7 days worth of readings.
The Graph and Logger menus
The Graph menu is found on every folder except the Loggers folder, where it is called Logger instead.
These commands are common to both the Graph and Logger menus:
- Installation details
View or edit details relating to the installation of the logger in the bottom pane of a single selected graph.
- Location
View or set the map location for a single selected graph. The map location is linked to the logger database that is viewed in the bottom pane of the graph.
- Navigate...
Go to Google Maps to navigate from your current location to the location of the logger shown in the bottom pane of the graph.
- Photos
View, upload or delete your photographs of the logger installation.
- Weather...
Go to meteoblue to view the current conditions for the location of the logger shown in the bottom pane of the graph.
- Report a fault
Create or update a fault record for the logger associated with the graph and optionally send an email.
- Alert settings
Choose whether to enable or disable alerts from selected graphs, loggers, folders or users sharing with you.
- Watch
Watch or unwatch the selected graphs. All watched items are collated in your "Watched folder".
- Edit main comment
Edit the main comment for the graph. This is displayed below the name and is accessed by an icon in the top-left when viewing the graph itself.
- New comment
Add a new comment to the end of all selected graphs.
The Logger menu contains these additional commands:
- Assign to user
Assign/unassign all selected loggers to another user. The loggers will appear in their Loggers folder and they will have full rights.
- Renew subscription
Navigate to the Subscriptions page to renew the subscriptions for all selected loggers. The subscriptions will appear under "Selected logger databases" on that page.
The Map menu
The Map menu appears when your view is a Google map.
- Terrain
Select this to show a topographic map of the terrain.
- Labels
Show labels on the map. This can't be deselected when showing terrain.
- Search
View a location by searching for a place name or address. If positioning a logger, the marker is moved there.
- Coords
View a location by entering a specific latitude and longitude. If positioning a logger, the marker is moved there.
- Your current location
View your current location according to the geolocation function of your device. If positioning a logger, the marker is moved there.
- Zoom to fit loggers
Scrolls and zooms the map to fit all loggers referenced by graphs in the view.
- Add logger location
Browse a list of loggers without map co-ordinates and select one to place on the map.
The Zones menu
The Zones menu appears when your view is a Google map.
- New zone
Draw a zone outline on the map and give it a name and other details.
- Order satellite images
Order NDVI, NDMI, MSAVI, NDRE or RECI satellite images for the currently highlighted zone.
- Details
Show or edit the details of the currently highlighted zone.
- (Zone list)
A list of the outermost zones (zones within other zones are not listed). Select a zone to view it and any zones within.
The "View" menu
The "View" menu is the drop-down menu at the right-end of the navigation bar, shown as a combination of icons that indicate the current view options. Use it to control how items are displayed and organized.
See Folder Viewing Options